- Blake Moret, Chairman and CEO

January
February
March
April
May
June
July
August
September
October
November
December
Rockwell Automation, Inc. (NYSE: ROK)
NYSE: ROK
As the world’s largest pure-play industrial automation and digital transformation company, we create outcomes that help our customers – industrial companies in more than 100 countries – to be more resilient, agile, and sustainable.”

Latest Events & News


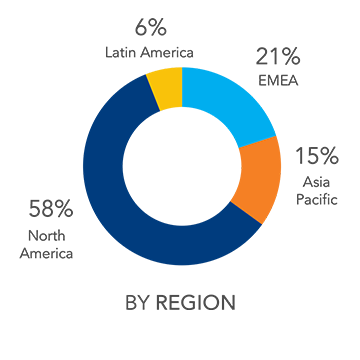
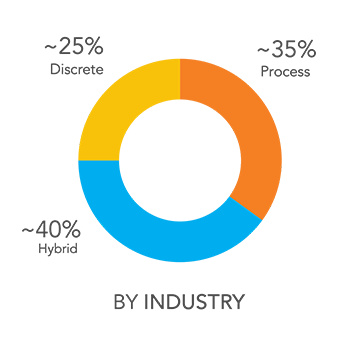
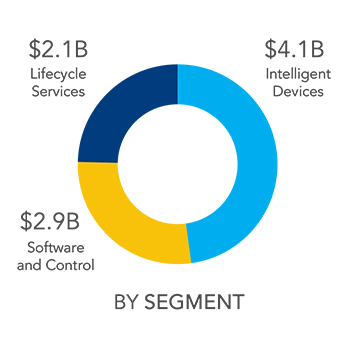
Rockwell At-a-Glance
Q1 Fiscal 2024 Highlights
Click the tiles to access quarterly highlights. View more financials here.


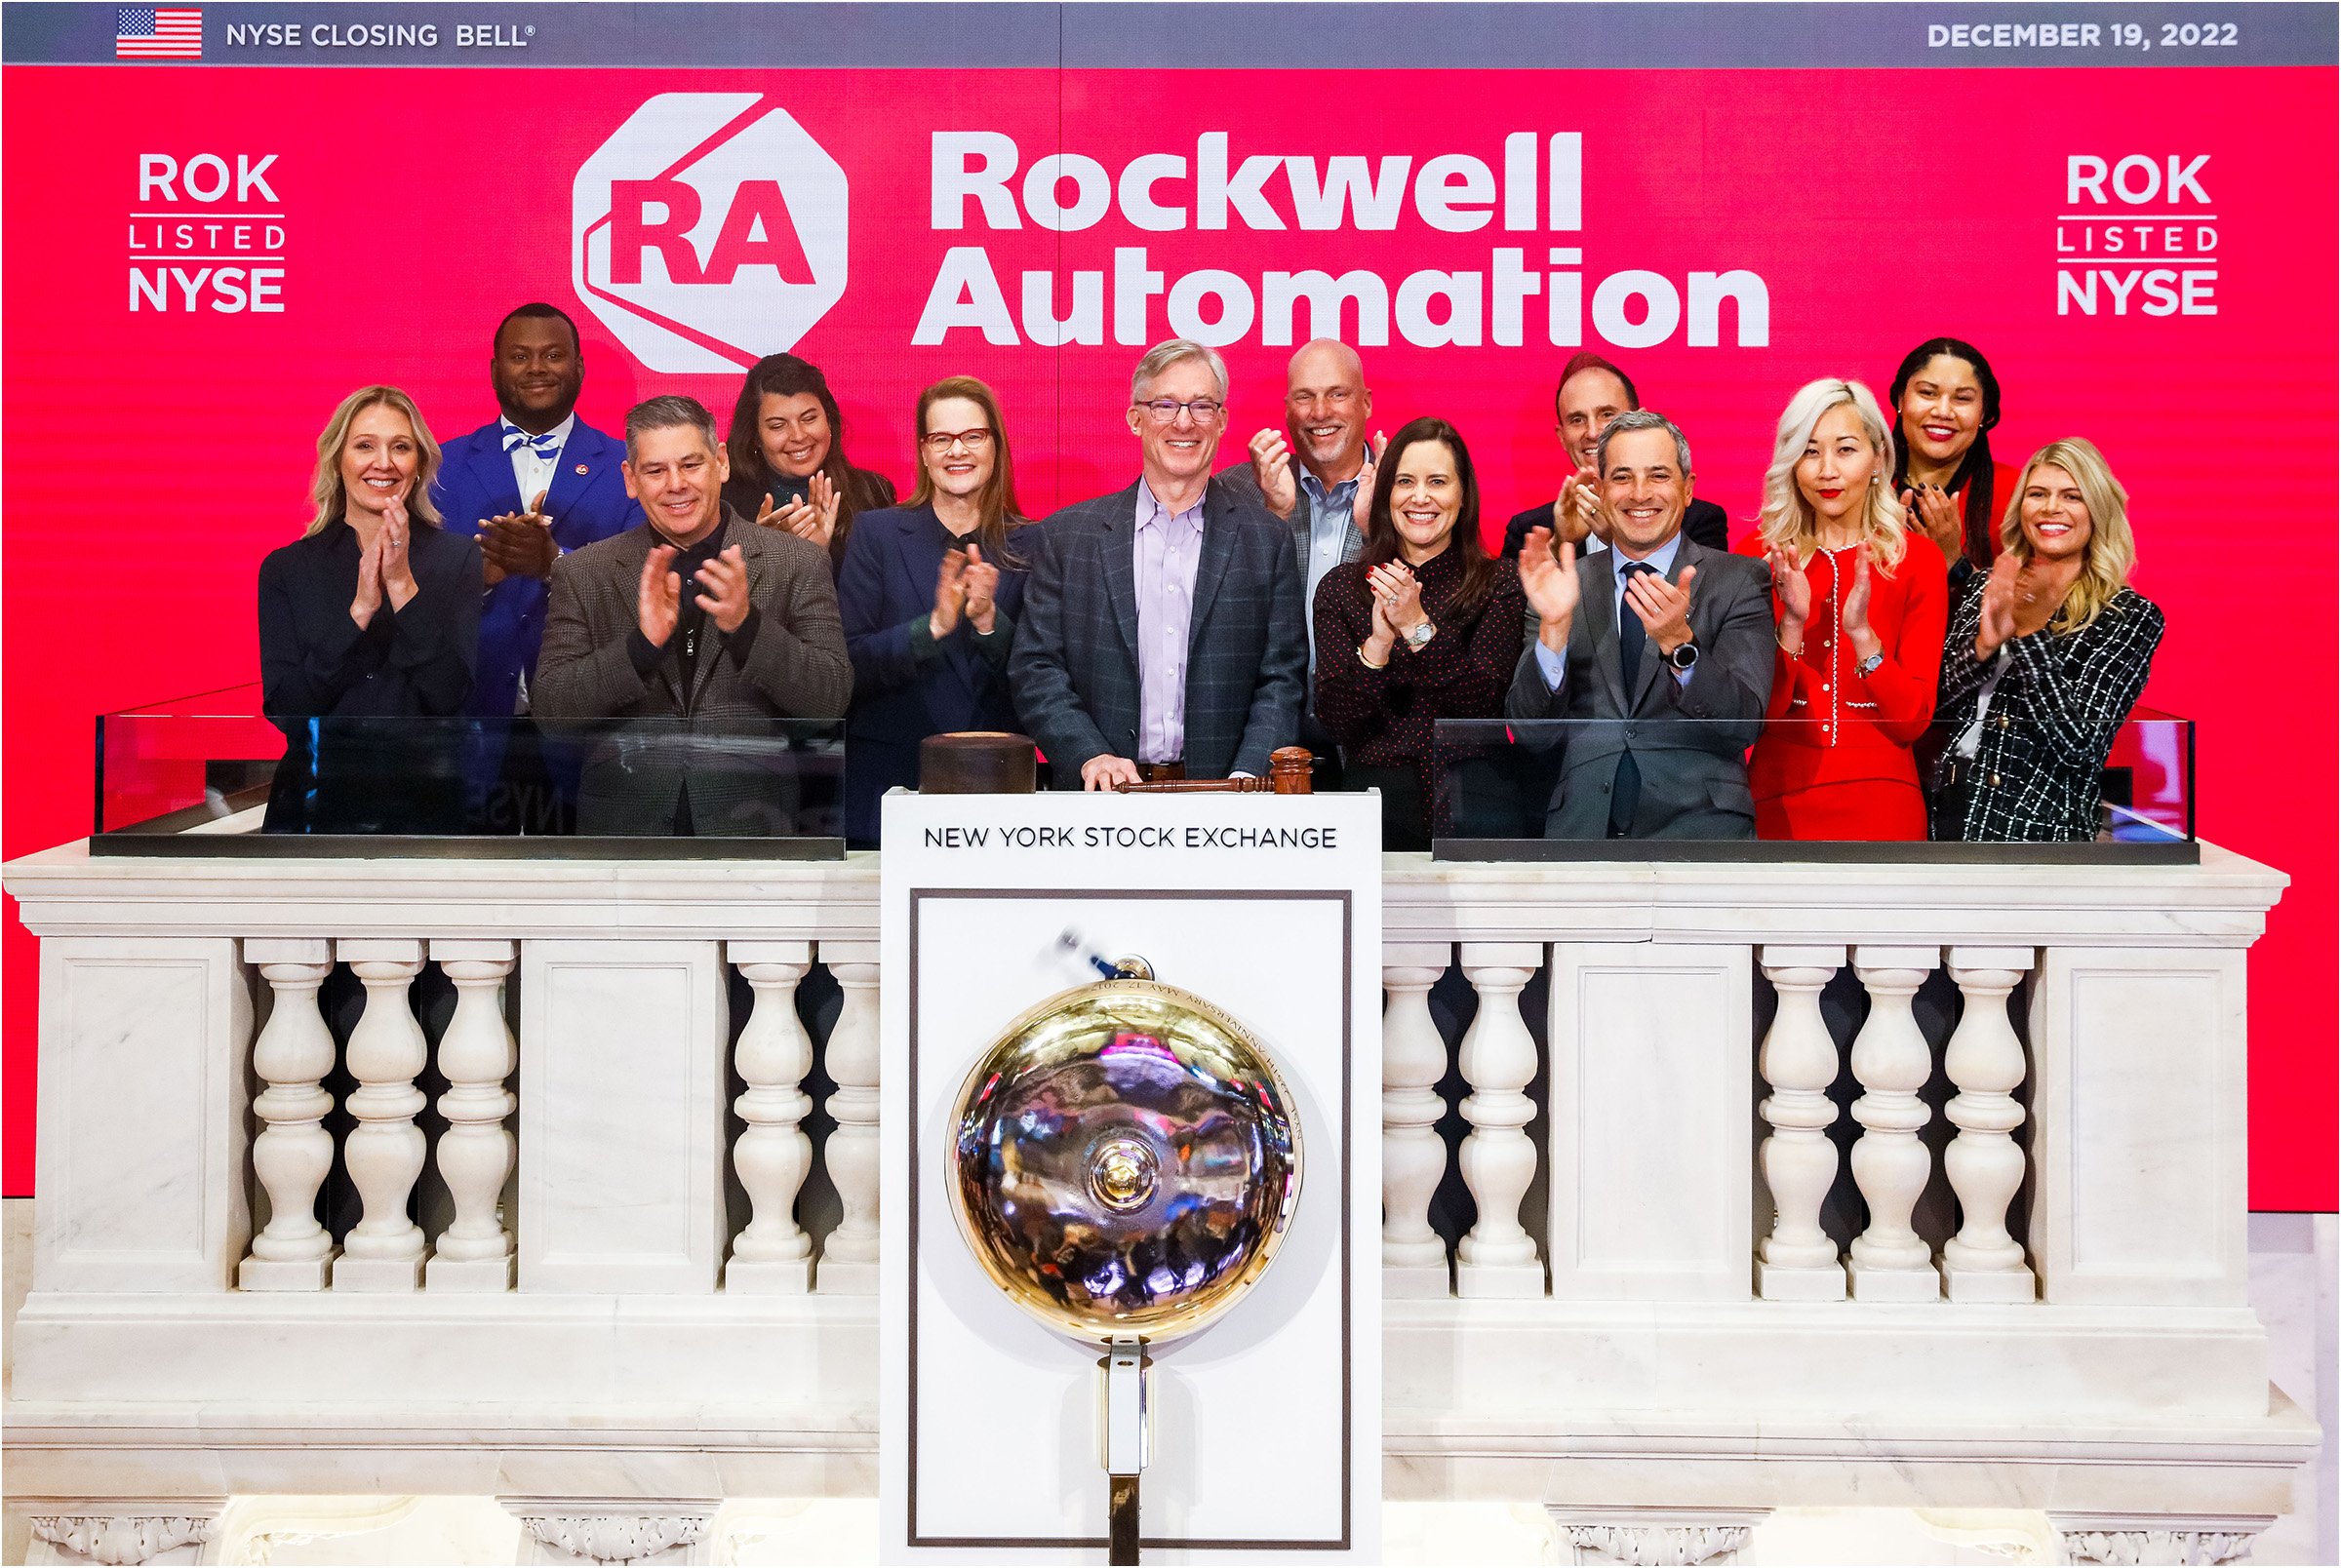
Celebrating 20+ Years on the NYSE